Russia’s summer Ukraine offensive looks like its deadliest yet
Our analysis of what it has cost both sides
Tracked fires, past 30 days
War-related fires
Other fires
Occupied by Russia
To track the war in Ukraine, The Economist uses satellite data from a NASA programme originally designed to monitor forest fires. Our algorithms assess if these fires are linked to the conflict—letting us map Russia’s summer offensive in near real time.
Heavy fire continues across the Dnipro river in the Kherson region. Much of this is caused by Russian drone strikes on farmland rather than a serious attempt to advance. A rumoured Russian amphibious assault is yet to happen.
In the north a 50,000-strong Russian force is attacking Sumy, a provincial capital. Our model is detecting artillery fire and explosions along the city’s northern defensive lines. Ukraine is badly outnumbered but officials say the front is holding.
In the north-east Russia is advancing on Borova and Siversk—tactical waypoints en route to the last remaining Ukrainian strongholds in the Donbas.
Russia’s main effort is further south. Pokrovsk and Kostiantynivka—two important logistical hubs for Ukraine—are being pummelled by the full weight of Vladimir Putin's army. Whether they hold could decide the fate of the eastern front.
Captured Russian officers in Ukraine reportedly say the summer offensive was presented to them as “one last push”. Mr Putin seems intent on breaking Ukrainian morale and snatching a victory after more than three years of war. He also seems willing to pay for it: our new modelling suggests that Russia’s daily death toll is higher than at any other point in the conflict.
There is no official tally of losses on either side. But our daily war tracker offers some clues. Our satellite data and shifts to areas of control suggest when the fighting is intensifying. This lines up well with more than 200 credible estimates of casualties from Western governments and independent researchers. By combining this data we can, for the first time, provide a credible daily death toll—or an estimate of estimates.
Estimated* total Russian losses
Russia-Ukraine war, February 24th 2022 to July 9th 2025, m
As of July 9th our tracker suggests there have been between 900,000 and 1.3m Russian casualties since the war began, including some 190,000–350,000 deaths. That updates assessments from other sources, which put total casualties above 1m at the end of June. Our numbers suggest roughly 31,000 Russians may have been killed in the summer offensive so far, which began in earnest on May 1st.
There is too little data to generate a comparable live estimate for Ukraine. However, a catalogue of the known dead and missing from UALosses, a website, implies that between 73,000 and 140,000 Ukrainian soldiers have died since the invasion began.
Russia’s rising death toll is the result of movements on the ground. Our satellite data suggest its current pace of advance is among the fastest in two years (albeit from a very low baseline). In recent weeks Ukraine has endured some of the heaviest drone and missile bombardments of the conflict. Early on July 9th Russia launched 700 drones mostly towards Lutsk, a city close to the border with Poland.
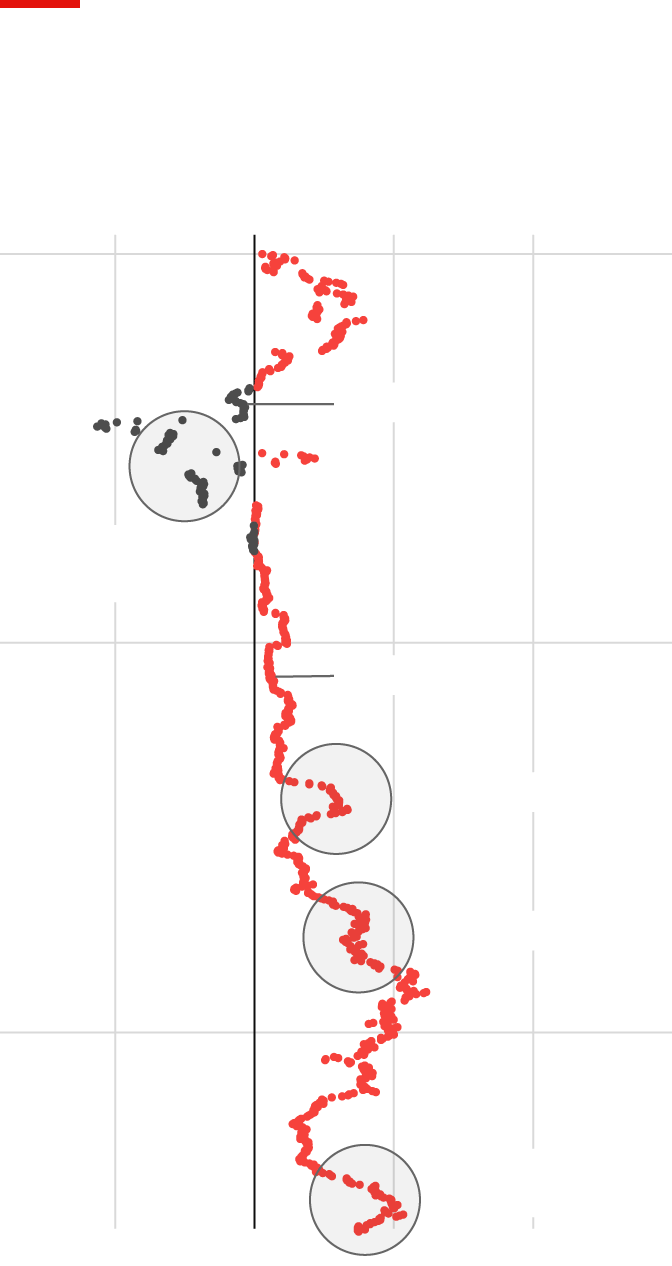
Daily change in Russian-controlled area
30-day moving average, km2
←Russian losses
Russian gains →
-20
0
40
20
2023
Bakhmut falls
Second Ukrainian
counter-offensive
2024
Avdiivka falls
Kharkiv offensive
Vuhledar falls
2025
Russian summer
offensive
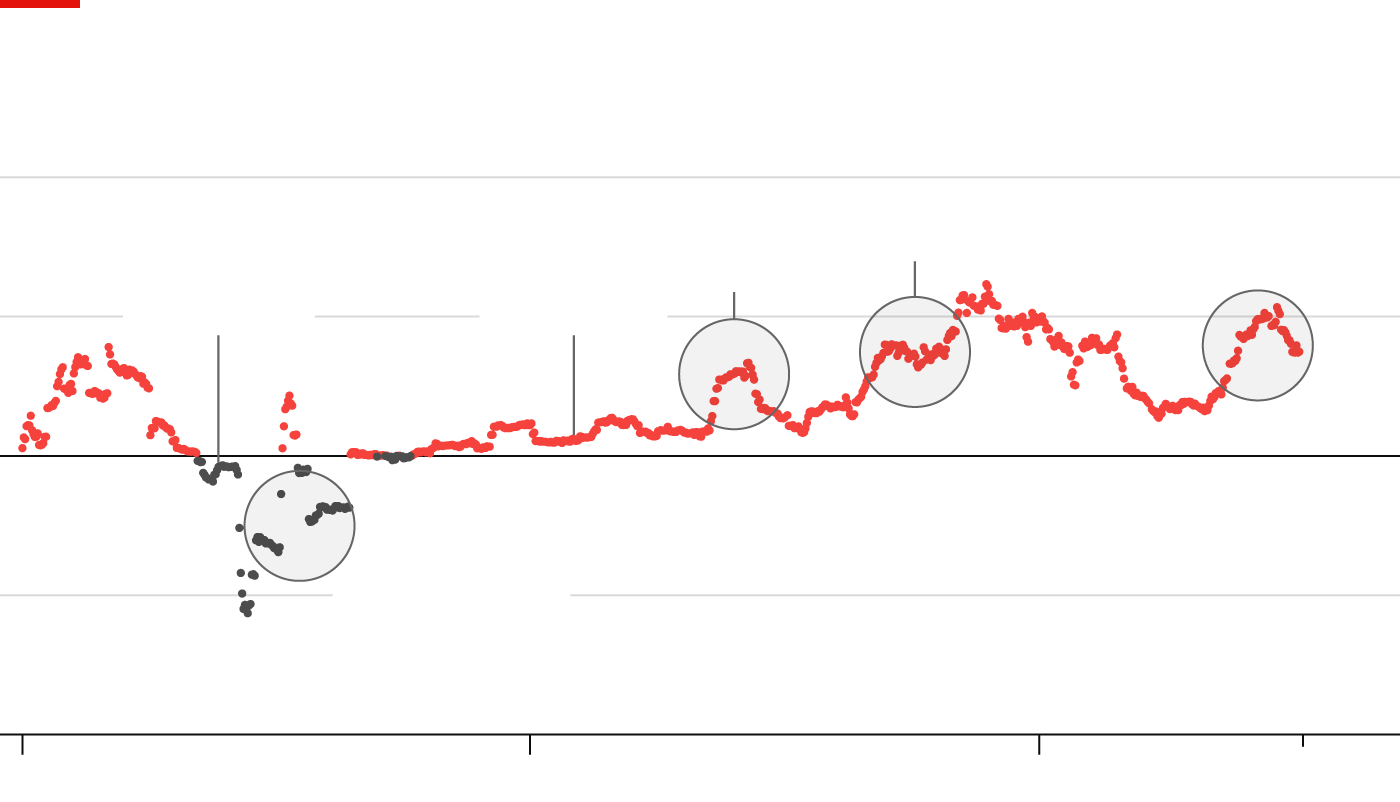
Daily change in Russian-controlled area
30-day moving average, km2
40
↑ Russian gains
Kharkiv
offensive
Vuhledar falls
Russian summer
offensive
20
Bakhmut falls
Avdiivka falls
0
-20
Second Ukrainian
counter-offensive
↓ Russian losses
-40
2024
2025
2023
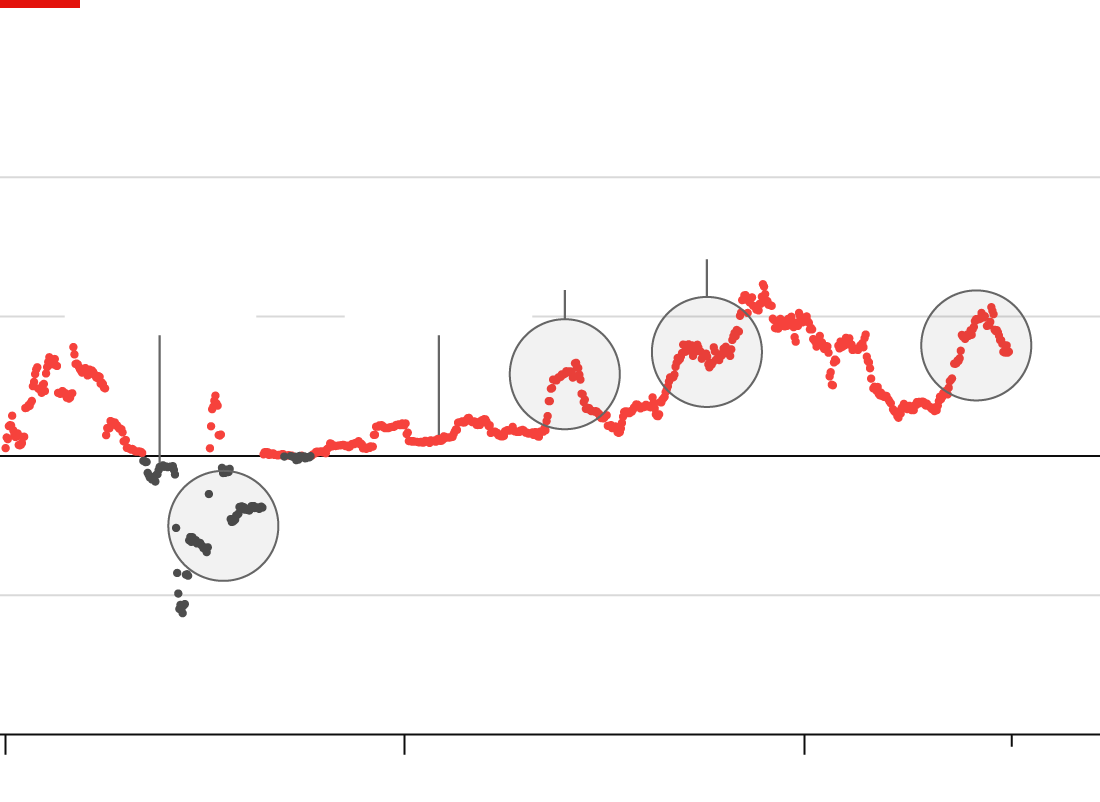
Daily change in Russian-controlled area
30-day moving average, km2
40
Kharkiv
offensive
Vuhledar falls
Russian summer
offensive
↑ Russian gains
20
Bakhmut falls
Avdiivka falls
0
Second Ukrainian
counter-offensive
-20
↓ Russian losses
-40
2024
2025
2023
Ukraine is still putting up a mighty defence against a far bigger power. Despite the summer push and delays to weapon shipments from America, Russia has little to show for its advances. The current offensive still works out at just 15 square kilometres per day—roughly the size of Los Angeles airport. Over the past year it has gained just 0.038 square km (about nine acres) per dead soldier. Even at the quicker pace of the past 30 days, it would take another 89 years to conquer all of Ukraine. Seizing the unoccupied parts of the four regions that Mr Putin already claims—Luhansk, Donetsk, Kherson and Zaporizhzhia—would take until February 2029.
Yet Mr Putin seems undeterred. His armed forces are recruiting 10,000-15,000 more troops per month than Ukraine’s are, luring Russians with generous sign-on bonuses and salaries rather than relying on the conscription now roiling Ukraine.
On July 7th Donald Trump announced that America will resume sending weapons to Ukraine. “They have to be able to defend themselves,” he said. “They’re getting hit very hard now.” We will continue to track the fighting, and the death toll that it implies.■
Sources: DMSP Nighttime Lights; ESA; EUMETSAT; Google Earth Engine; Institute for the Study of War; NASA; WorldPop; OpenStreetMap; Bing Maps; BBC Russia; CIA; CSIS; D. Kobak; French officials; IISS; Mediazone; Meduza; Pentagon; US officials; UK MoD; UK officials; Western intelligence agencies; The Economist
Russia’s summer Ukraine offensive looks like its deadliest yet
Our analysis of what it has cost both sides
Tracked fires, past 30 days
War-related fires
Other fires
Occupied by Russia
To track the war in Ukraine, The Economist uses satellite data from a NASA programme originally designed to monitor forest fires. Our algorithms assess if these fires are linked to the conflict—letting us map Russia’s summer offensive in near real time.
Heavy fire continues across the Dnipro river in the Kherson region. Much of this is caused by Russian drone strikes on farmland rather than a serious attempt to advance. A rumoured Russian amphibious assault is yet to happen.
In the north a 50,000-strong Russian force is attacking Sumy, a provincial capital. Our model is detecting artillery fire and explosions along the city’s northern defensive lines. Ukraine is badly outnumbered but officials say the front is holding.
In the north-east Russia is advancing on Borova and Siversk—tactical waypoints en route to the last remaining Ukrainian strongholds in the Donbas.
Russia’s main effort is further south. Pokrovsk and Kostiantynivka—two important logistical hubs for Ukraine—are being pummelled by the full weight of Vladimir Putin's army. Whether they hold could decide the fate of the eastern front.
Captured Russian officers in Ukraine reportedly say the summer offensive was presented to them as “one last push”. Mr Putin seems intent on breaking Ukrainian morale and snatching a victory after more than three years of war. He also seems willing to pay for it: our new modelling suggests that Russia’s daily death toll is higher than at any other point in the conflict.
There is no official tally of losses on either side. But our daily war tracker offers some clues. Our satellite data and shifts to areas of control suggest when the fighting is intensifying. This lines up well with more than 200 credible estimates of casualties from Western governments and independent researchers. By combining this data we can, for the first time, provide a credible daily death toll—or an estimate of estimates.
Estimated* total Russian losses
Russia-Ukraine war, February 24th 2022 to July 9th 2025, m
As of July 9th our tracker suggests there have been between 900,000 and 1.3m Russian casualties since the war began, including some 190,000–350,000 deaths. That updates assessments from other sources, which put total casualties above 1m at the end of June. Our numbers suggest roughly 31,000 Russians may have been killed in the summer offensive so far, which began in earnest on May 1st.
There is too little data to generate a comparable live estimate for Ukraine. However, a catalogue of the known dead and missing from UALosses, a website, implies that between 73,000 and 140,000 Ukrainian soldiers have died since the invasion began.
Russia’s rising death toll is the result of movements on the ground. Our satellite data suggest its current pace of advance is among the fastest in two years (albeit from a very low baseline). In recent weeks Ukraine has endured some of the heaviest drone and missile bombardments of the conflict. Early on July 9th Russia launched 700 drones mostly towards Lutsk, a city close to the border with Poland.
Daily change in Russian-controlled area
30-day moving average, km2
←Russian losses
Russian gains →
-20
0
40
20
2023
Bakhmut falls
Second Ukrainian
counter-offensive
2024
Avdiivka falls
Kharkiv offensive
Vuhledar falls
2025
Russian summer
offensive
Daily change in Russian-controlled area
30-day moving average, km2
40
↑ Russian gains
Kharkiv
offensive
Vuhledar falls
Russian summer
offensive
20
Bakhmut falls
Avdiivka falls
0
-20
Second Ukrainian
counter-offensive
↓ Russian losses
-40
2024
2025
2023
Daily change in Russian-controlled area
30-day moving average, km2
40
Kharkiv
offensive
Vuhledar falls
Russian summer
offensive
↑ Russian gains
20
Bakhmut falls
Avdiivka falls
0
Second Ukrainian
counter-offensive
-20
↓ Russian losses
-40
2024
2025
2023
Ukraine is still putting up a mighty defence against a far bigger power. Despite the summer push and delays to weapon shipments from America, Russia has little to show for its advances. The current offensive still works out at just 15 square kilometres per day—roughly the size of Los Angeles airport. Over the past year it has gained just 0.038 square km (about nine acres) per dead soldier. Even at the quicker pace of the past 30 days, it would take another 89 years to conquer all of Ukraine. Seizing the unoccupied parts of the four regions that Mr Putin already claims—Luhansk, Donetsk, Kherson and Zaporizhzhia—would take until February 2029.
Yet Mr Putin seems undeterred. His armed forces are recruiting 10,000-15,000 more troops per month than Ukraine’s are, luring Russians with generous sign-on bonuses and salaries rather than relying on the conscription now roiling Ukraine.
On July 7th Donald Trump announced that America will resume sending weapons to Ukraine. “They have to be able to defend themselves,” he said. “They’re getting hit very hard now.” We will continue to track the fighting, and the death toll that it implies.■
Sources: DMSP Nighttime Lights; ESA; EUMETSAT; Google Earth Engine; Institute for the Study of War; NASA; WorldPop; OpenStreetMap; Bing Maps; BBC Russia; CIA; CSIS; D. Kobak; French officials; IISS; Mediazone; Meduza; Pentagon; US officials; UK MoD; UK officials; Western intelligence agencies; The Economist